
19 Million Ads — Mapping the Commercial Sex Market Across America
Mar 30, 2026
In 2024, researchers captured 19.3 million unique online commercial sex advertisements from three major websites. That is more than 50,000 ads per day. Approximately 200,000 publicly accessible images were referenced daily.
This data does not measure trafficking. It measures visible market activity. But as a demand-side indicator, it reveals where commercial sex markets are most active, where they are concentrated, and where enforcement and prevention resources may be misaligned.
This is the fifth post in our series on the 2026 State Human Trafficking Report. It focuses on online advertisement data collected and analyzed by Dr. Greg Bott, Associate Professor at the University of Alabama Institute for Data Analytics, in partnership with his colleague Dr. Nick Freeman. The team has been collecting data from online commercial sex ads since 2019 and has published extensively on their methods.
How the Data Is Collected
The methodology begins with scraping ads from the most relevant websites. The team then solves a critical linking problem: do 1,000 ads represent 1,000 individuals, or 100 people posting 10 times each?
To answer this, they use multiple deduplication methods. Phone numbers are one indicator. Perceptual hashing compares images that are similar but not identical. But the most effective method is stylometry: analyzing how people write their ads. Patterns in emoji use, capitalization, misspellings, and phrasing are highly indicative of the same individual.
Finally, ads are mapped to county-level FIPS codes, enabling county and state-level aggregation.
Three important caveats apply. The data captures only publicly posted ads on three websites. It does not include mobile apps, encrypted messaging platforms, the dark web, or private networks. Not all ads represent trafficking; some reflect consensual commercial sex and others are scam ads. And providers often post in multiple cities simultaneously, which can affect geographic precision.
Constant Demand: The National Picture
The key takeaway at the national level is persistence. The digital commercial sex marketplace remains high-volume and consistent month to month.
The annual average in 2024 was 1.6 million ads per month, with a steady baseline above 1.5 million. Minor fluctuations occurred due to anti-scraping countermeasures by the sites themselves and the addition of new data sources to the collection.
Dr. Bott summarized: “The key takeaway is constant demand.”
Geographic Patterns Challenge Assumptions
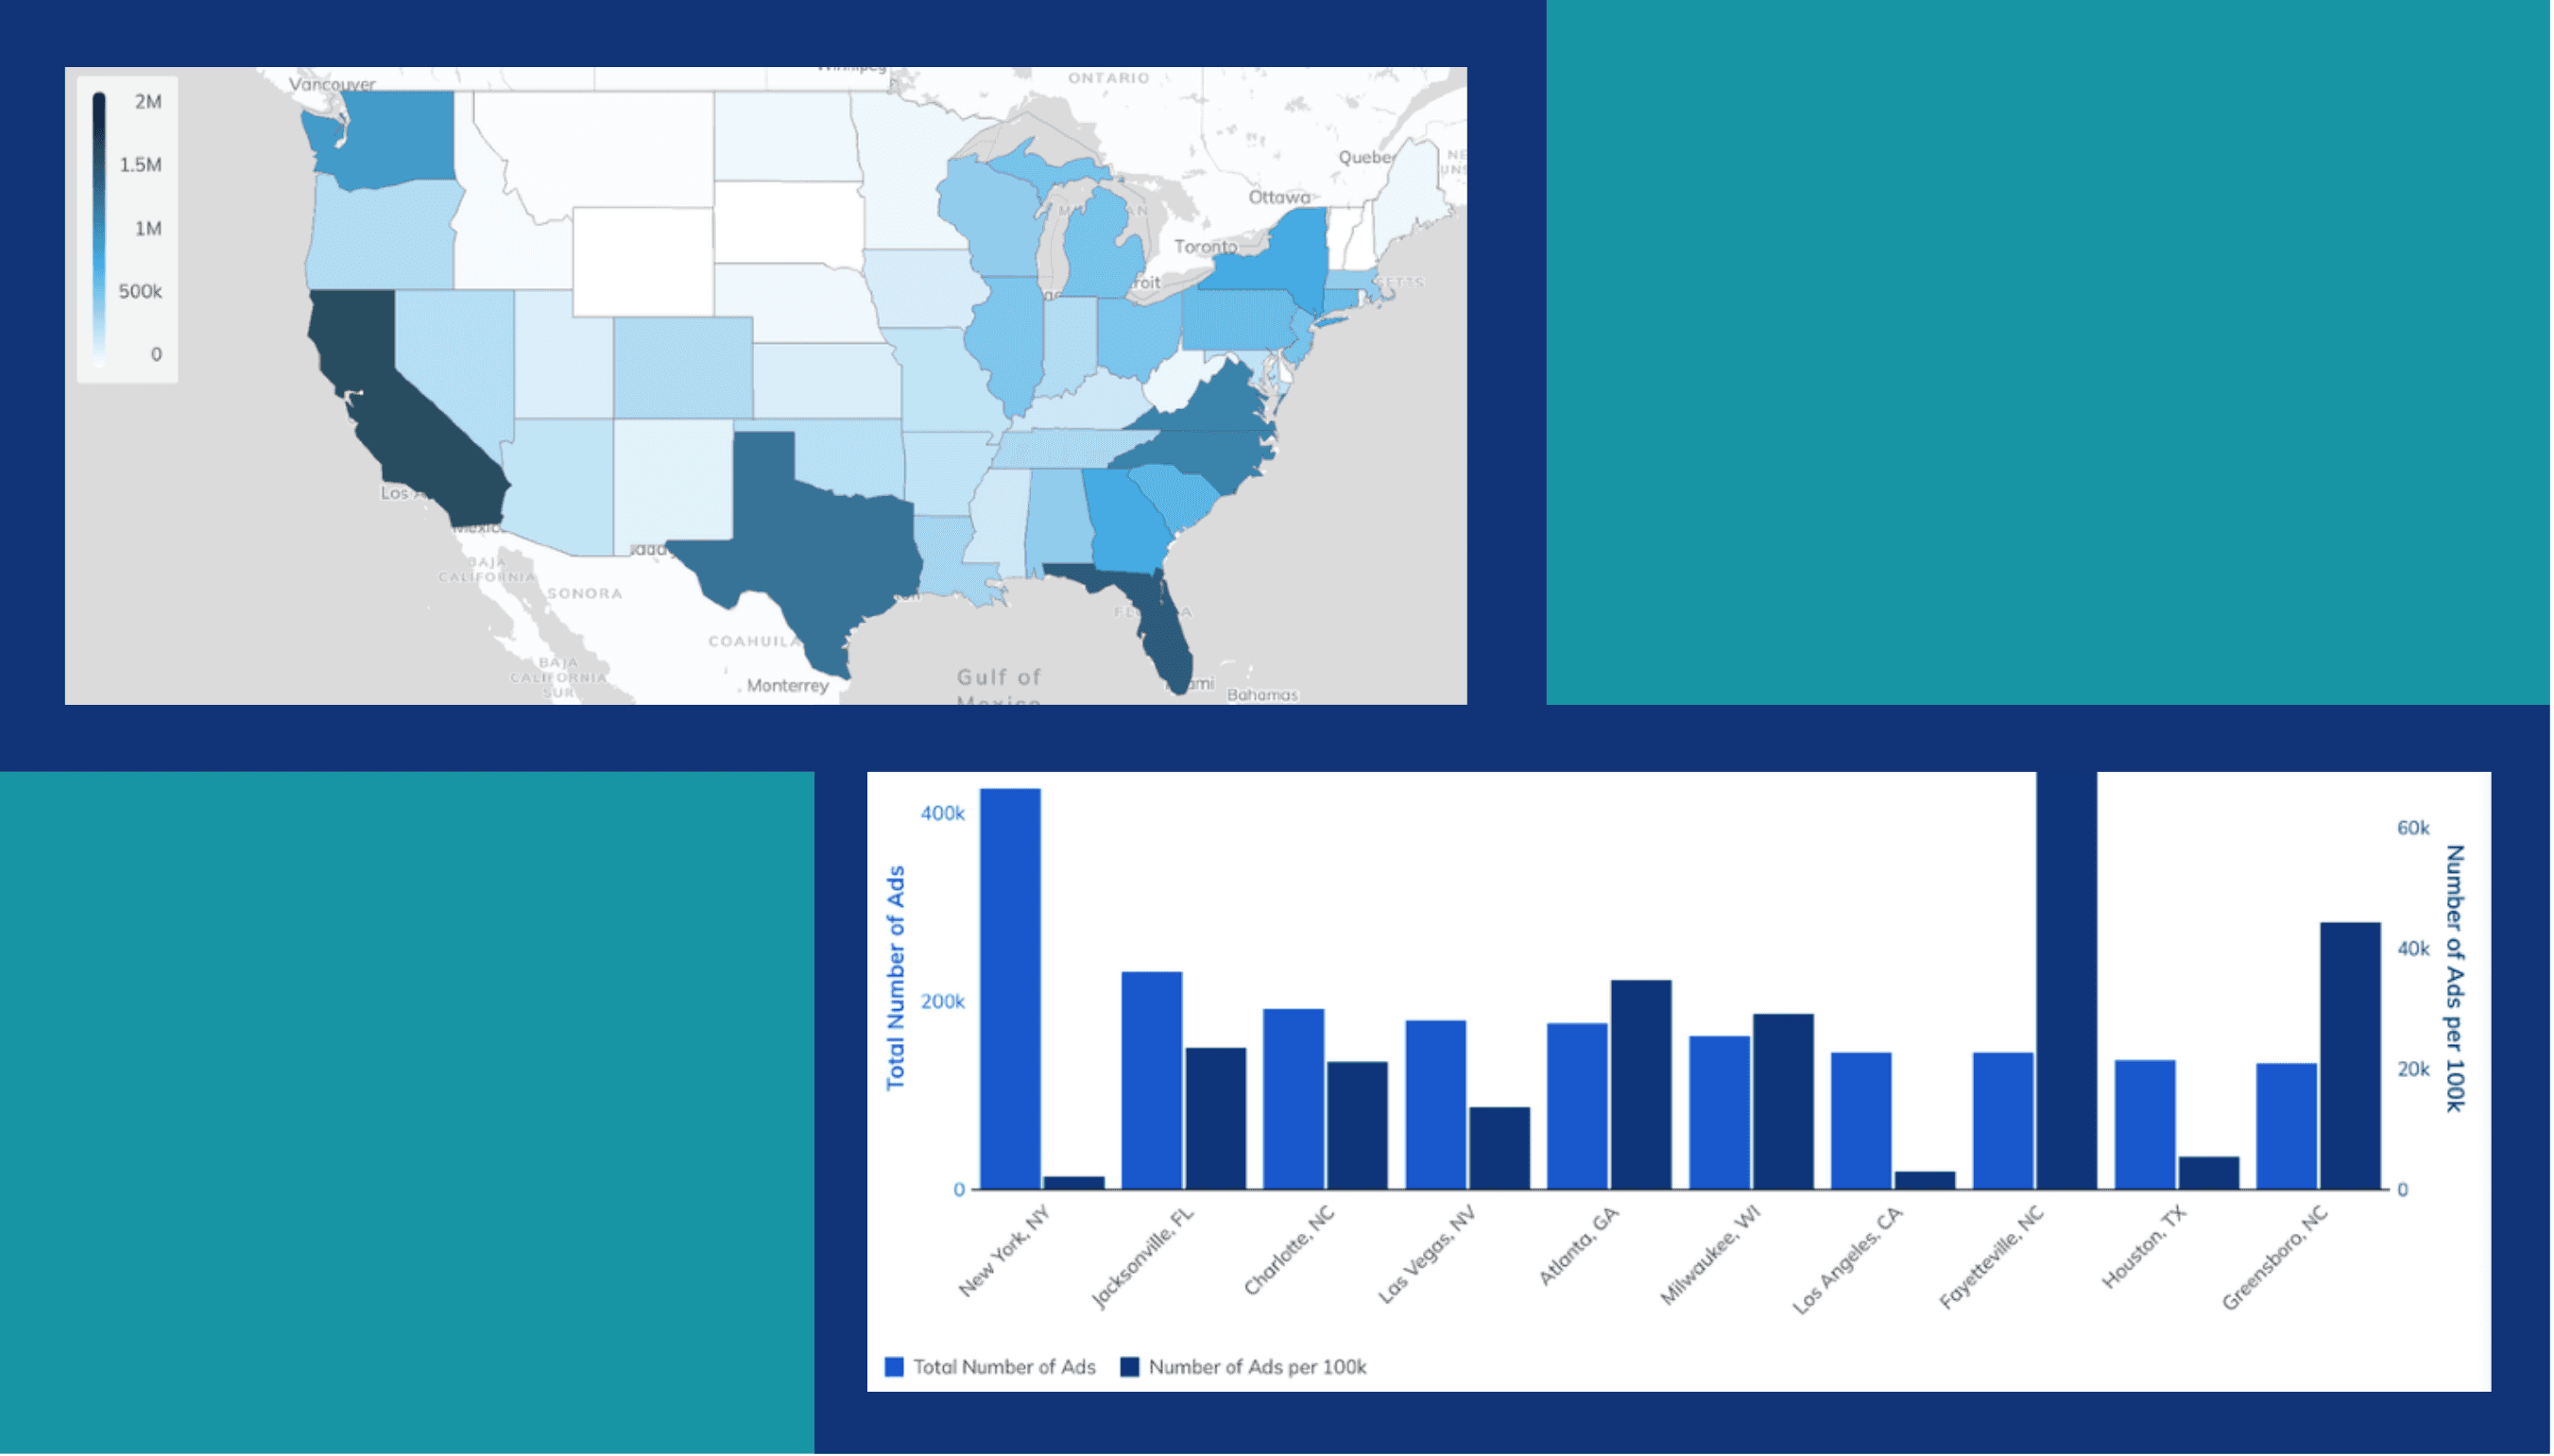
By total ad volume, the expected states lead: California (1.5 million), Florida (1.4 million), Texas (1.2 million). But North Carolina and Virginia also appeared in the top five despite not being among the most populous states.
States with the lowest ad volumes tracked with the least populated states: Vermont (185), Alaska (213), Wyoming (373).
The more revealing analysis is per capita. When ad volume is normalized per 100,000 residents, the rankings shift significantly. Connecticut leads with 16,000 ads per 100,000 population. South Carolina follows at nearly 13,000. Virginia is at 12,500.
California drops from the top position when normalized. Connecticut and South Carolina emerge as high-intensity states despite their smaller populations. North Carolina and Virginia remain elevated in both measures.
Dr. Bott explained: “Raw totals indicate market size. Normalized rates indicate high demand relative to population.” That distinction is critical for deciding where to direct enforcement, prevention, and regulatory resources.
Surprising City-Level Patterns
At the city level, New York City leads by total volume with 426,000 ads. But the next two cities are not what most people would expect: Jacksonville, Florida and Charlotte, North Carolina.
When normalized for population, North Carolina cities continue to lead. Fayetteville and Greensboro have the highest per capita ad counts.
This reinforces a key principle from the data. Large cities dominate in total volume. But mid-sized cities can show significantly higher relative intensity. That has direct implications for where local task forces and state agencies should focus attention.
When Datasets Converge and Diverge
The strategic value of this dataset increases dramatically when triangulated with others.
When ad volume is high but hotline reports and prosecutions are low, it signals potential under-detection, weak reporting pathways, or limited investigative capacity. When different datasets converge on the same geography, it strengthens confidence in strategic targeting.
During the webinar Q&A, an attendee asked whether traffickers are adapting to avoid detection. Dr. Bott’s response was candid: “After 7 years doing this, they’re not looking. They have no idea what we’re doing.” He noted that even academic researchers rarely read the published methodology, let alone the subjects of the research.
What This Means for the Field
Three strategic implications emerge from the ad data.
First, high normalized ad volume identifies where commercial sex markets are most active relative to population. These are priority geographies for enforcement, regulatory review, and prevention investment.
Second, when triangulated with other datasets, systems-level gaps can be detected. A state with high ad volume but low hotline reports and low prosecution counts deserves closer examination.
Third, the data can guide resource allocation when layered with hotline, prosecution, screening, and venue data. This triangulated intelligence model provides strategic value that no single dataset can offer.
Explore Your State’s Ad Data
Every state profile in the report includes a dedicated page on online commercial sex advertisements, including total ad volume, per capita rates, and top cities.
Partner With Us
The University of Alabama Institute for Data Analytics has partnered with Allies Against Slavery to make this data available through the Lighthouse platform. If your organization works in law enforcement, research, or demand reduction and wants to leverage this data, we want to connect.
Learn about partnership opportunities
Together, we can turn market signals into strategic action.
See Your State’s Ad Data
How does commercial sex ad volume in your state compare to the national picture?